
Key Summary
Cohort analysis is a data analysis technique that groups users or customers based on shared characteristics or experiences and tracks their behavior over time. Instead of looking at an entire customer base as one group, cohort analysis helps businesses understand how different groups behave, retain, convert, and generate revenue.
Understanding cohort analysis meaning is especially useful for professionals working with customer data, product analytics, marketing, and business intelligence. It can reveal patterns that traditional aggregate metrics often hide.
What is cohort analysis?
Cohort analysis is the process of dividing users, customers, or other entities into groups called cohorts based on a shared characteristic and then analyzing their behavior over a defined period.
For example, an e-commerce company could group customers according to the month in which they made their first purchase. Customers who first purchased in January form one cohort, while customers who first purchased in February form another.
The business can then compare these groups to understand:
- How many customers return after their first purchase
- How quickly customers make repeat purchases
- Which acquisition periods produced the most valuable customers
- How retention changes over time
- Whether customer behavior is improving or declining
This is why understanding what is cohort analysis is important for anyone working in data-driven decision-making.
Unlike a simple monthly report, cohort analysis focuses on the behavior of a consistent group over time.
How does cohort analysis work?
The process generally begins with raw customer or user-level data and transforms it into groups that can be tracked over time.
A. Extract Raw Data:
The first step is to collect the information required for analysis. Depending on the objective, this could include:
- Customer ID
- Transaction date
- Signup date
- Purchase amount
- Product or service used
- Subscription status
- Marketing channel
- Geographic information
For example, a dataset may contain customer transactions such as:
import pandas as pd
data = {
“customer_id”: [101, 101, 102, 103, 102],
“purchase_date”: [
“2026-01-10”,
“2026-02-15”,
“2026-01-20”,
“2026-02-05”,
“2026-03-12”
],
“amount”: [100, 150, 200, 75, 250]
}
df = pd.DataFrame(data)
df[“purchase_date”] = pd.to_datetime(df[“purchase_date”])
print(df)
The raw data needs to be structured properly before cohort calculations can begin.
B. Create Cohort Identifiers:
Once the data is prepared, each customer can be assigned to a cohort.
A common approach is to use the month of the customer’s first transaction:
df[“cohort_month”] = (
df.groupby(“customer_id”)[“purchase_date”]
.transform(“min”)
.dt.to_period(“M”)
)
df[“purchase_month”] = df[“purchase_date”].dt.to_period(“M”)
print(df)
Here, cohort_month represents when the customer first entered the business, while purchase_month represents when the customer performed an activity.
The difference between these dates can then be used to measure customer retention.
Why cohort analysis matters
1.) It separates signal from noise
Overall metrics can hide important changes in customer behavior.
For example, a company may report that its customer retention rate is 60%. That number does not explain whether customers acquired this month are performing better or worse than customers acquired six months ago.
Cohort analysis provides this additional context by tracking comparable groups over time.
2.) It identifies retention levers
Cohort analysis can help identify where customers begin to disengage.
If customers consistently stop using a product after their second month, the business can investigate what happens during that period and introduce onboarding, engagement, or support initiatives.
3.) It connects behavior to revenue
Customer behavior can also be connected to revenue metrics.
Businesses can compare cohorts based on:
- Average revenue per customer
- Repeat purchase frequency
- Customer lifetime value
- Subscription upgrades
- Churn
- Conversion rates
This helps companies understand not only who stays but also which customer groups create the most business value.
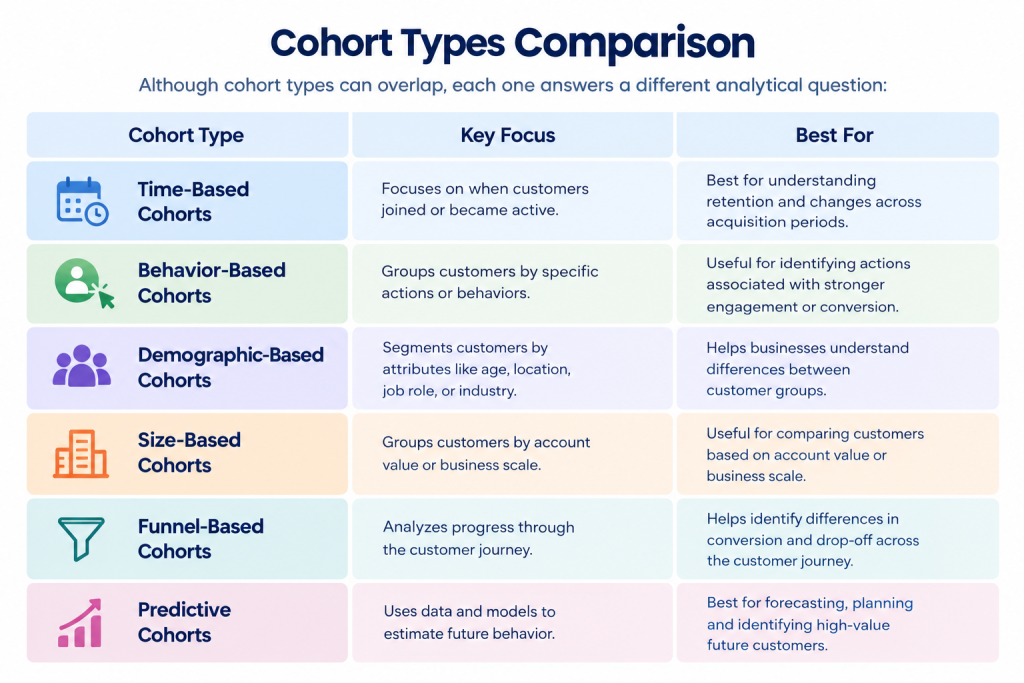
Types of Cohort Analysis
There are several ways to define cohorts depending on the business question.
1. Time-Based Cohort Analysis
Users are grouped according to a specific time period when they performed an important action.
Examples include:
- Signup month
- First purchase month
- Subscription start month
- First app installation week
Time-based cohorts are commonly used for retention and customer lifecycle analysis.
2.Behavior-Based Cohort Analysis
Customers are grouped according to a specific behavior.
For example, a SaaS company could create cohorts based on whether customers:
- Used a particular feature
- Completed onboarding
- Created their first project
- Invited another user
This approach helps determine whether particular behaviors are associated with better outcomes.
3. Demographic-Based Cohort Analysis
Users can also be grouped using demographic characteristics such as:
- Age group
- Location
- Industry
- Customer segment
This can help businesses identify differences in engagement and purchasing patterns.
4. Size-Based Cohort Analysis
Customers can be grouped according to business value or account size.
For example, a B2B software company may separately analyze small businesses, mid-market companies, and enterprise customers.
Size-based cohorts group customers according to metrics such as revenue, order value, account size, or number of users. For example, an enterprise SaaS company might separately analyze customers with fewer than 50 employees, companies with 50–500 employees, and larger organizations.
This can reveal whether retention and lifetime value differ significantly between customer segments.
5. Funnel-Based Cohort Analysis
Funnel-based cohorts focus on where users are within a conversion journey.
A business may compare users who:
- Visited the website
- Registered for an account
- Started a trial
- Completed onboarding
- Purchased a product
This helps identify where different groups drop out of the customer journey.
6. Acquisition cohorts
Acquisition cohorts group customers based on when they entered the business.
For example, users acquired in January can be compared with users acquired in February and March.
This is particularly useful for measuring retention and evaluating acquisition campaigns.
7. Behavioral cohorts
Behavioral cohorts group users according to actions they have taken.
For example, an application might compare users who used a particular feature with users who did not.
8. Predictive cohorts
Predictive cohorts use historical data and analytical models to group customers according to expected future behavior.
For example, customers could be categorized according to their likelihood of:
- Churning
- Making another purchase
- Upgrading
- Becoming high-value customers
Steps to Conduct Cohort Analysis
Step -1 Define Goals and Questions
Start by identifying the business question.
Instead of simply asking whether customers are returning, ask:
Are customers acquired through our latest marketing campaign retaining better than customers acquired previously?
A specific question determines which cohort definition and metrics are appropriate.
Step -2 Choose Cohort Definition
Select the characteristic that will determine the cohort.
This could be:
- Signup date
- First purchase
- Subscription start
- Product usage
- Marketing channel
- Customer segment
Step -3 Identify Relevant Metrics
Choose metrics that directly support the analysis.
Common cohort metrics include:
- Retention rate
- Churn rate
- Revenue
- Customer lifetime value
- Repeat purchases
- Average order value
- Conversion rate
Step -4 Gather Your Data
Collect the required customer-level information from databases, CRM platforms, analytics tools, transaction systems, or application logs.
Data quality is critical because incorrect dates, missing customer IDs, or duplicate transactions can distort cohort results.
Step -5 Analyze the Cohorts
Compare each cohort across consistent time intervals.
For example, a business could examine what percentage of customers remained active after:
- Month 1
- Month 2
- Month 3
- Month 6
The resulting patterns can reveal where retention improves or deteriorates.
Step -6 Take Action
Cohort analysis should ultimately support business decisions.
If a particular cohort performs significantly better, investigate what contributed to its performance. If retention falls sharply at a specific stage, identify what can be changed.
Examples of Cohort Analysis
1. E-commerce Platform
An e-commerce company can group customers by the month of their first purchase.
It can then measure how many customers make another purchase in subsequent months.
If the January cohort has a much higher repeat purchase rate than the March cohort, the business can investigate changes in marketing campaigns, pricing, product availability, or customer experience.
2. SaaS Company
A SaaS company can group customers according to their subscription start month.
The company can then measure:
- Trial-to-paid conversion
- Monthly retention
- Feature usage
- Upgrades
- Churn
This can help identify whether newer customers are experiencing better onboarding and product engagement.
3. Mobile Gaming App
A mobile game can create cohorts based on installation date. It can then analyze whether players remain active after one, seven, or thirty days. If retention improves after a particular game update, the development team can investigate whether the new features contributed to the improvement.
4. Streaming Service
A streaming platform can group subscribers based on signup month, acquisition channel, or initial content preference.
The company can then examine whether users who joined through specific campaigns or content categories remain subscribers longer.
Python Implementation – Cohort Analysis
Python provides libraries such as pandas and Matplotlib that make cohort analysis easier to perform.
1.) Import the necessary Libraries
import pandas as pd
import matplotlib.pyplot as plt
2.) Load the dataset
A real-world dataset could be stored in a CSV file:
df = pd.read_csv(“customer_transactions.csv”)
df[“purchase_date”] = pd.to_datetime(df[“purchase_date”])
3. Data Cleaning
Before creating cohorts, check for missing values and duplicate records.
df = df.dropna(subset=[“customer_id”, “purchase_date”])
df = df.drop_duplicates()
df = df.sort_values([“customer_id”, “purchase_date”])
4. Cohort Analysis
df[“cohort_month”] = (
Create a cohort month based on each customer’s first transaction:
df.groupby(“customer_id”)[“purchase_date”]
.transform(“min”)
.dt.to_period(“M”)
)
df[“purchase_month”] = df[“purchase_date”].dt.to_period(“M”)
Next, calculate the number of months between the cohort month and the purchase month:
df[“cohort_index”] = (
(df[“purchase_month”].dt.year – df[“cohort_month”].dt.year) * 12
+ (df[“purchase_month”].dt.month – df[“cohort_month”].dt.month)
+ 1
)
The resulting cohort_index indicates how many months have passed since the customer joined.
We can then calculate the number of unique customers in each cohort:
cohort_data = (
df.groupby([“cohort_month”, “cohort_index”])[“customer_id”]
.nunique()
.reset_index()
)
5. Visualize the Results
The results can be converted into a retention matrix:
cohort_pivot = cohort_data.pivot(
index=”cohort_month”,
columns=”cohort_index”,
values=”customer_id”
)
retention = cohort_pivot.divide(
cohort_pivot.iloc[:, 0],
axis=0
)
print(retention)
A simple visualization can then make the retention trend easier to interpret:
plt.figure(figsize=(10, 6))
plt.plot(
retention.columns,
retention.iloc[0],
marker=”o”
)
plt.xlabel(“Months Since Acquisition”)
plt.ylabel(“Retention Rate”)
plt.title(“Cohort Retention”)
plt.show()
6. Explore
Once the cohort data is created, analysts can investigate questions such as:
- Which cohort has the highest retention?
- At what point does retention decline most sharply?
- Are newer cohorts performing better?
- Which acquisition periods generated higher-value customers?
- Did a product or marketing change affect retention?
The value of Python lies not only in calculating these metrics but also in making it easier to repeat and automate the analysis.
Best practices for cohort analysis
1.) Segment beyond the defaults
Do not rely only on monthly acquisition cohorts.
Combine cohort analysis with dimensions such as acquisition source, product, geography, customer type, or behavior when there is enough data to support meaningful comparisons.
2.) Compare cohorts across dimensions
A cohort may perform differently depending on how the customer was acquired or what product they initially used.
Comparing these dimensions can uncover patterns that a single cohort view may miss.
3.) Automate your monitoring
For businesses that regularly track retention, cohort analysis should not remain a one-time exercise.
Automating data collection and reporting allows teams to identify changes as they happen.
4.) Share findings with cross-functional teams
Cohort insights can be useful to more than the analytics team.
Marketing, product, sales, customer success, and leadership teams can use the findings to make better decisions.
5.) Connect insights to action fast
The objective is not simply to identify that one cohort performs poorly.
The next step should be understanding why and determining what can be changed.
Common mistakes to avoid
1. Ignoring sample size
A small cohort can produce misleading results.
Always consider how many users are included before drawing strong conclusions.
2. Confusing correlation with causation
If one cohort performs better after a product update, that does not automatically mean the update caused the improvement.
Other factors may have changed at the same time.
3. Analyzing without acting
A retention chart is not the final outcome.
The analysis should lead to questions, experiments, product changes, marketing decisions, or customer engagement initiatives.
4. Starting without clean data
Duplicate transactions, incorrect timestamps, missing customer IDs, and inconsistent records can significantly affect cohort calculations.
Data preparation should therefore happen before analysis.
What Is Cohort Analysis in Data Science?
In data science, cohort analysis is used to study how groups of users behave over time.
It is particularly useful when the timing and sequence of user actions matter.
Why Cohort Analysis Matters
Traditional aggregate metrics provide an overall picture, but they do not always explain behavioral changes.
Cohort analysis adds a time-based or characteristic-based perspective, making it easier to identify patterns within specific groups.
It can also be combined with statistical analysis, predictive modeling, and machine learning to investigate why certain cohorts behave differently.
Key Terms You Should Know
a. Cohort: A group of users sharing a defining characteristic or event.
b. Retention: The percentage of users who remain active over a specific period.
c. Churn: The percentage of customers who stop using a product or service.
d. Acquisition: The process through which a business gains new customers or users.
e. Cohort period: The time interval used to define or measure a cohort.
f. Lifetime value: The estimated revenue or profit a customer generates throughout their relationship with a business.
Understanding these terms makes it easier to interpret cohort analysis results and communicate findings.
Real-World Applications of Cohort Analysis
1. E-commerce and Retail
Retailers can use cohort analysis to track repeat purchases, customer retention, average order value, and customer lifetime value.
It can also help evaluate whether specific acquisition campaigns generate customers who remain active for longer.
2. SaaS Products
SaaS businesses frequently use cohort analysis to understand subscription retention and churn.
They can compare customers based on signup date, plan, feature adoption, or acquisition channel.
3. Mobile Apps
Mobile applications can analyze cohorts based on installation date or user behavior.
Retention metrics can help product teams understand whether users continue engaging with the application after their first interaction.
4. Ed-Tech and Online Learning
Education platforms can track students according to enrollment date, course type, or engagement level.
This can reveal differences in course completion, recurring engagement, and subscription retention.
5. Financial Services
Financial institutions can use cohort analysis to study customer acquisition, transaction behavior, product adoption, and retention.
For example, customers who opened accounts during different periods can be compared to determine whether their engagement patterns have changed.
Conclusion
Cohort analysis provides a structured way to understand how groups of customers or users behave over time. Instead of relying only on overall averages, businesses can examine specific groups and identify meaningful differences in retention, revenue, engagement, and conversion.
Understanding what is cohort analysis and how to do cohort analysis is valuable for data analysts, product managers, marketers, and business professionals who work with customer data.
Python makes the process even more practical. Libraries such as pandas can be used to clean data, create cohort identifiers, calculate retention, and organize results for further analysis.
The most important step, however, is not creating a cohort report. It is using the insights to understand customer behavior and make better business decisions.
Frequently Asked Questions (FAQs)
1. What is cohort analysis in simple terms?
Cohort analysis is a method of studying groups of users or customers who share a common characteristic and tracking how their behavior changes over time. For example, a company can group customers based on the month they made their first purchase and compare their repeat purchases in later months.
2. What is the difference between cohort analysis and segmentation?
Segmentation divides customers into groups based on characteristics such as demographics, location, industry, or behavior. Cohort analysis also creates groups, but it usually focuses on tracking how those groups behave over time. Cohort analysis is therefore particularly useful for understanding retention, churn, engagement, and customer lifecycle patterns.
3. What is cohort analysis used for in product management?
Product teams use cohort analysis to understand how different groups of users adopt and engage with a product. It can help identify retention problems, evaluate the impact of product changes, understand feature adoption, and determine whether newer users are performing better than earlier user groups.
4. How do you calculate cohort retention rate?
Cohort retention rate is generally calculated by comparing the number of active users from a cohort during a later period with the number of users in that cohort during its starting period. The result is expressed as a percentage. Tracking this percentage across multiple periods helps reveal how quickly different cohorts lose or retain users.
5. What tools are used for cohort analysis?
Cohort analysis can be performed using spreadsheets, SQL, Python, business intelligence platforms, product analytics tools, and customer data platforms. Python libraries such as pandas are particularly useful when analysts need to clean large datasets, calculate cohort metrics, automate analysis, or build customized visualizations.