
Estimation is one of the most debated topics in Agile development. Teams need a way to forecast effort, plan sprints, and deliver predictable outcomes without falling back into rigid, time-based planning models. This is where Agile estimation techniques come into play.
Among the most popular approaches are Story Points and T-Shirt Sizing. While both methods estimate effort relatively (instead of in hours), they serve slightly different purposes and are suited for different stages of planning.
Understanding story points vs T-shirt sizing is essential for Scrum Masters, product owners, and developers who want accurate sprint planning and realistic delivery forecasts.
In this blog, we’ll explore both techniques in depth, compare them technically, demonstrate how they impact sprint forecasting with coding examples, and explain when to use each approach.
Overview of Agile Estimation Techniques
Agile estimation focuses on relative effort, not absolute time. Instead of asking:
“How many hours will this take?”
Agile asks:
“How complex is this compared to other work?”
Common Agile estimation techniques include:
- Story Points (Fibonacci scale)
- T-Shirt Sizing (XS, S, M, L, XL)
- Planning Poker
- Affinity Estimation
- Bucket System
The goal is to improve predictability without micromanaging time.
What Are Story Points?
Story Points measure the relative effort required to complete a user story. They consider:
- Complexity
- Risk
- Uncertainty
- Volume of work
Most teams use the Fibonacci sequence:
1, 2, 3, 5, 8, 13, 21…
The gaps increase intentionally to reflect uncertainty in larger tasks.
Example
User Story:
“As a user, I want to reset my password via email.”
If this involves:
- Backend API
- Email service integration
- Token validation
- Frontend form
The team may estimate it as 5 story points.
A more complex feature like: “Implement real-time notifications with WebSockets” might be 13 story points.
How Story Points Help in Sprint Planning
Story points enable velocity tracking.
Example: If past sprint velocities were:
import statistics
velocities = [28, 32, 30, 35, 29]
average_velocity = statistics.mean(velocities)
print(“Average Velocity:”, average_velocity)
If average velocity is 30 story points, the team plans approximately 30 points for the next sprint.
This makes sprint forecasting data-driven.
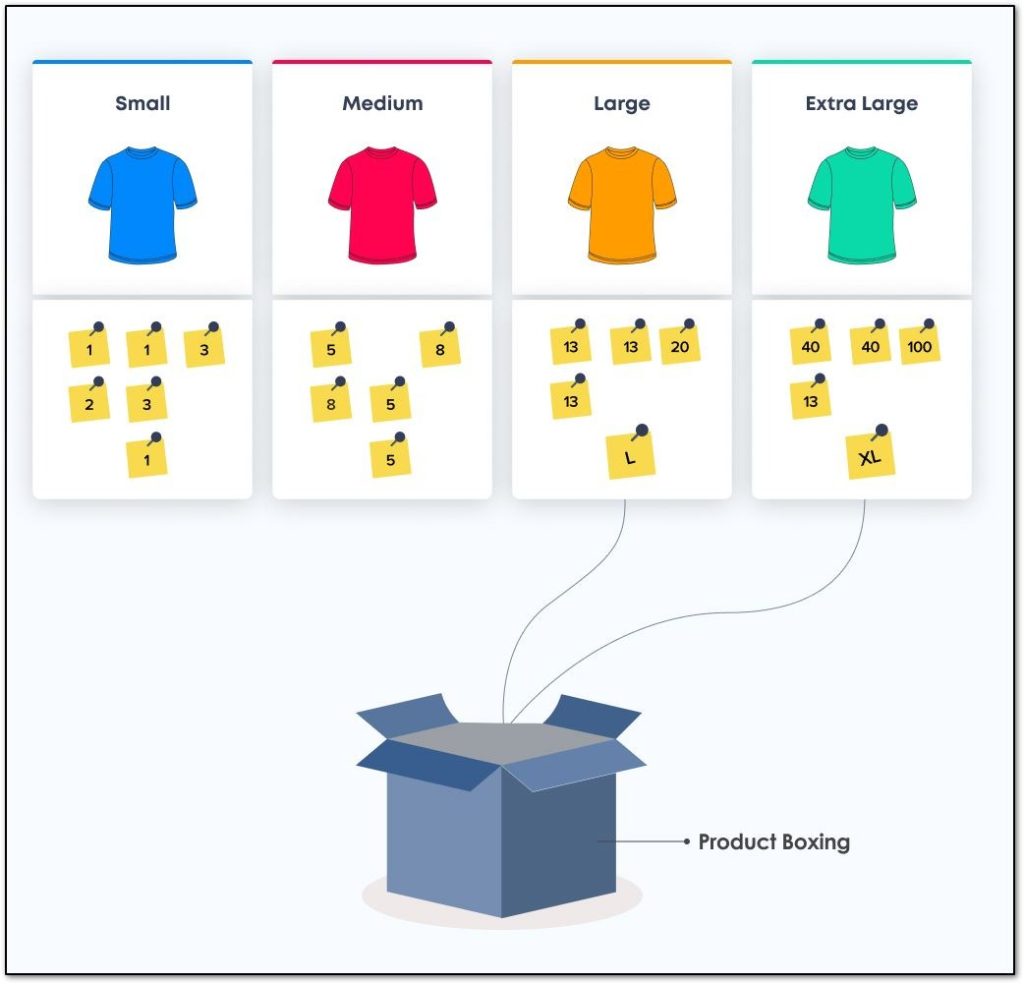
What Is T-Shirt Sizing?
T-Shirt Sizing is a high-level estimation technique that categorizes tasks into sizes:
- XS
- S
- M
- L
- XL
Instead of assigning numeric effort, teams classify stories into size buckets based on relative effort.
For example:
- Fix typo in UI → XS
- Add user profile page → M
- Build payment gateway integration → XL
T-shirt sizing is commonly used in:
- Early product planning
- Roadmap discussions
- Backlog refinement sessions
It is less precise but faster than story point estimation.
Comparing Story Points vs T-Shirt Sizing
Story points provide more granular estimation using a numeric scale. They are ideal for sprint-level planning and velocity tracking.
T-shirt sizing offers quick categorization without detailed analysis. It is better suited for high-level estimation and early planning.
Story points allow precise velocity measurement, enabling predictive sprint capacity planning. T-shirt sizing, however, is simpler and less cognitively demanding, making it useful for large backlogs or when teams are new to estimation.
In short:
- Story Points = Detailed, sprint-focused
- T-Shirt Sizing = High-level, roadmap-focused
When to Use Story Points
Story points are best used when:
1. Sprint Planning Requires Precision
If you need to commit to a sprint backlog, story points provide better predictability.
2. Tracking Velocity Over Time
Velocity tracking depends on numeric estimation.
Example velocity calculation:
completed_points = [30, 28, 32]
print(“Total Completed:”, sum(completed_points))
Without numeric values, tracking progress becomes difficult.
3. Teams Are Mature and Stable
Teams familiar with relative estimation can use story points effectively.
4. You Need Data-Driven Forecasting
Story points allow forecasting release timelines.
Example:
If backlog = 120 story points
Average velocity = 30
backlog = 120
velocity = 30
sprints_needed = backlog / velocity
print(“Estimated Sprints:”, sprints_needed)
This gives leadership predictable timelines.
When to Use T-Shirt Sizing
T-shirt sizing works best in the following scenarios:
1. Early Product Discovery
When features are not fully defined, assigning precise story points is premature.
2. Large Backlog Grooming Sessions
If you need to categorize 100+ items quickly, T-shirt sizing saves time.
3. High-Level Roadmapping
Example roadmap:
- Q1: 3 Large features
- Q2: 2 Medium + 1 XL feature
4. New Teams
Teams unfamiliar with story points may find T-shirt sizing easier initially.
You can later convert sizes into approximate points.
Example conversion logic:
size_to_points = {
“XS”: 1,
“S”: 2,
“M”: 5,
“L”: 8,
“XL”: 13
}
print(size_to_points[“L”])
This hybrid mapping helps transition to numeric estimation.
Can You Use Both? Hybrid Approaches
Yes. Many teams combine both techniques.
Step 1: Use T-Shirt Sizing for High-Level Planning
During backlog refinement:
- Assign S, M, L sizes quickly.
Step 2: Convert to Story Points Before Sprint Planning
Once stories are refined, convert sizes into story points.
Example:
stories = [“S”, “M”, “L”, “M”]
total_points = sum(size_to_points[size] for size in stories)
print(“Sprint Total Points:”, total_points)
Hybrid approaches reduce estimation fatigue while preserving precision.
Best Practices for Agile Estimation
1. Estimate Relatively, Not in Hours
Avoid converting story points directly into hours. Story points measure effort complexity, not time.
2. Use Planning Poker for Consensus
Collaborative estimation reduces bias.
3. Recalibrate Periodically
If velocity changes significantly, re-evaluate estimation patterns.
4. Avoid Over-Precision
If debate lasts 20 minutes over 5 vs 8 points, estimation has become counterproductive.
5. Track Historical Data
Use metrics such as:
- Average velocity
- Story completion rate
- Spillover frequency
Example:
spillover = [5, 3, 0, 4]
print(“Average Spillover:”, statistics.mean(spillover))
Frequent spillovers may indicate overestimation or scope creep.
6. Focus on Outcomes, Not Just Numbers
Estimation supports delivery but does not guarantee success. Always align estimation with business value.
Common Mistakes in Estimation
- Treating story points as hours
- Comparing team velocities
- Overcomplicating estimation scales
- Ignoring uncertainty buffers
- Using estimation for performance evaluation
Estimation is a planning tool, not a productivity metric.
Conclusion
Agile estimation techniques help teams plan effectively without rigid time constraints. Understanding the difference between story points vs T-shirt sizing allows teams to choose the right method at the right time.
Story points provide precision and enable velocity-based forecasting, making them ideal for sprint planning and delivery tracking. T-shirt sizing offers speed and simplicity, making it valuable for high-level roadmap planning and early-stage backlog refinement.
Rather than choosing one exclusively, many high-performing Agile teams adopt a hybrid approach, using T-shirt sizing for broad categorization and story points for sprint execution.
Ultimately, estimation is not about predicting the future perfectly. It is about creating shared understanding, managing uncertainty, and improving predictability over time. When used thoughtfully, Agile estimation techniques empower teams to deliver consistently, adapt quickly, and maintain alignment between technical execution and business goals.