In today’s fast-paced digital landscape, effective monitoring and visualization of data have become crucial for businesses to maintain optimal performance and make informed decisions. Two powerful tools that have revolutionized this space are Grafana and Docker. When combined, they create a formidable solution for monitoring and visualizing data in a containerized environment.
Understanding Grafana and Docker
Grafana is an open-source analytics and monitoring platform that allows users to query, visualize, and alert on metrics from various data sources. Docker, on the other hand, is a platform that enables developers to package applications and their dependencies into containers, ensuring consistency across different environments.
When Grafana is deployed using Docker, it brings together the best of both worlds – powerful visualization capabilities and the flexibility of containerization.
Advantages of Running Grafana in Docker
Isolation and Portability
One of the primary benefits of running Grafana in Docker is the isolation it provides. Docker containers encapsulate Grafana and its dependencies, preventing conflicts with other applications on the system. This isolation ensures that Grafana can be configured with specific versions without affecting the host environment or other software.
Moreover, Docker’s portability allows Grafana setups to be easily replicated across different environments, from development to production, without the risk of configuration drift. This consistency ensures that every instance of Grafana behaves the same, regardless of where it is deployed.
Scalability and Resource Management
Docker containers are lightweight and easy to scale, making it simple to spin up additional Grafana instances when monitoring needs grow. Docker orchestration tools like Kubernetes can automate scaling based on load, ensuring a robust and flexible Grafana deployment.
Key Docker Concepts for Grafana Deployment
To effectively deploy Grafana using Docker, it’s essential to understand some key Docker concepts:
- Docker Image: A static specification for a container. The official Grafana Docker image contains all necessary components to run Grafana in a containerized environment.
- Container: A running instance of a Docker image. When deploying Grafana, you create a container from the Grafana image, which includes everything needed to run the application.
- Docker Compose: A tool for defining and managing multi-container setups, useful when deploying Grafana alongside other services like Prometheus or Loki.
Setting Up Grafana in Docker
Step 1: Pulling the Grafana Docker Image
To begin, pull the latest Grafana Docker image from Docker Hub:

Step 2: Running Grafana as a Container
Once the image is pulled, run Grafana as a container:

This command starts Grafana and maps port 3000 on the host to port 3000 in the container.
Step 3: Using Docker Compose for Advanced Setups
For more complex setups involving multiple containers, Docker Compose is invaluable. Here’s an example docker-compose.yml file that deploys both Grafana and Prometheus:
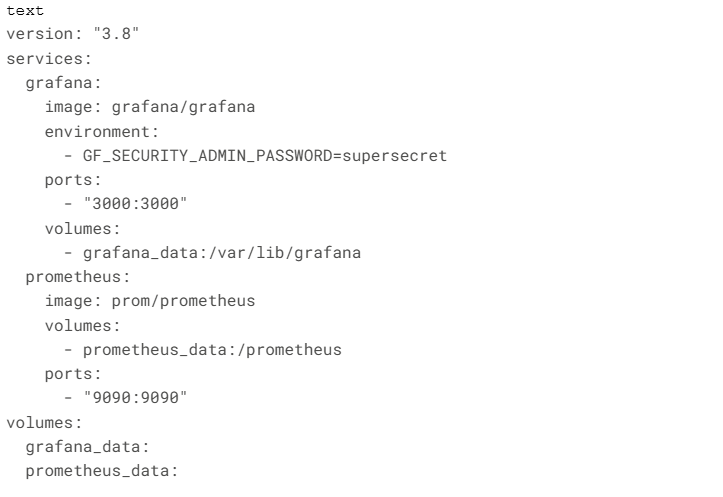
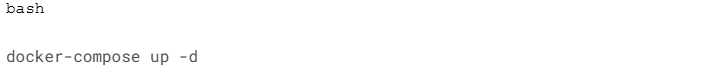
To bring up both containers simultaneously, use:
Optimizing Grafana Performance in Docker
Resource Allocation
To ensure optimal performance, it’s crucial to manage Docker’s resource allocation effectively:
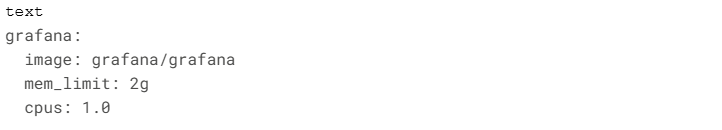
This configuration limits Grafana’s memory usage to 2GB and allocates 1 CPU core.
Persistent Data Storage
To prevent data loss during container restarts, use Docker volumes for persistent storage:

Security Considerations
When deploying Grafana in Docker, consider these security measures:
- Use environment variables for sensitive data
- Configure SSL using a reverse proxy
- Limit external access to the Grafana dashboard
Advanced Integrations
Grafana with Loki for Log Aggregation
Integrate Loki with Grafana for powerful log aggregation capabilities:

Prometheus and Grafana for Comprehensive Monitoring
Combine Prometheus with Grafana for a robust monitoring solution. Use cAdvisor to collect Docker container metrics: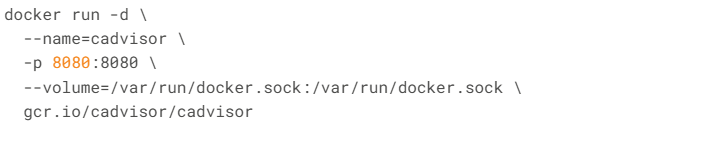
Best Practices and Troubleshooting
To ensure a smooth Grafana deployment in Docker:
- Implement health checks
- Regularly backup Grafana configurations
- Use multi-stage builds for custom Grafana images
When troubleshooting, common issues include:
- Container startup failures
- Data not updating
- Blank dashboards
- Slow dashboard loading
- Frequent container restarts
Address these issues by checking Docker logs, verifying data source configurations, and ensuring proper resource allocation.
Conclusion
The combination of Grafana and Docker offers a powerful solution for monitoring and visualizing data in modern, containerized environments. By leveraging Docker’s portability and isolation alongside Grafana’s advanced visualization capabilities, organizations can create scalable, efficient, and flexible monitoring infrastructures.
As businesses continue to embrace microservices and distributed systems, tools like Grafana and Docker will play an increasingly crucial role in maintaining visibility and performance across complex IT landscapes.
Read more such articles from our Newsletter here.