Your application is never in just one place. A single user click can travel through pods, serverless functions, databases, caches, and external APIs before a response returns. Somewhere along that path, things occasionally slow down or fail. When they do, hand-waving guesses waste time. Engineers need to have hard facts that reveal what broke, how serious it is, and where exactly to start digging. Logs, metrics, and traces supply those facts. Each pillar answers a distinct question, and together they turn confusion into a step-by-step investigation. Let’s understand metrics vs logs vs traces and beyond:
What Are Logs
A log is a time-stamped snapshot of one event. It might be a plain-text line in a file, a JSON document in object storage, or a structured message on a stream. Logs shine at detail. They capture user IDs, request bodies, stack traces, and feature flags, giving you the full context of each moment. Auditors use logs to confirm who changed a setting at 2 a.m. Debug sessions rely on them to see which parameter triggered an edge-case crash.
Log volume grows with traffic, so you need a plan that keeps them searchable without exploding storage costs. Compression helps. Hot and cold tiers keep recent logs in fast storage while moving older ones to cheaper disks. Sampling keeps every error yet only a slice of healthy requests. The rule is simple: whatever remains must be findable during an outage.
What Are Metrics
Metrics are numbers that describe system health over time. A counter ticks up for every request. A gauge shows current memory use. A histogram groups latency into buckets. Because metrics arrive pre-aggregated, they use little space even at high traffic. Dashboards and alert rules love metrics because trends pop out instantly. If error-rate jumps from one percent to five, a graph spikes long before anyone can scroll through raw logs.
Metrics answer questions of scale: how many, how often, how large. They do not tell which user triggered the spike, so metrics complement rather than replace logs. The usual debate of logs vs metrics boils down to detail versus speed. Metrics detect trouble fast; logs explain the gritty details.
What Are Traces
A trace follows a single request through every part of the system. Each hop records a span with start time, end time, and tags such as SQL text or external URL. All spans share a trace ID, so you can rebuild the entire journey in one view. Traces are priceless when latency spikes but no single log file tells the whole story. They reveal causal order, showing that a cache miss led to a database lock which stalled the user. In serverless or event-driven setups, traces bridge gaps where local logs have no shared context. Many teams find that once tail latency hurts customers, logs vs traces becomes the key pairing: traces locate the slow link, logs show why.
Logs vs Metrics vs Traces: Key Differences
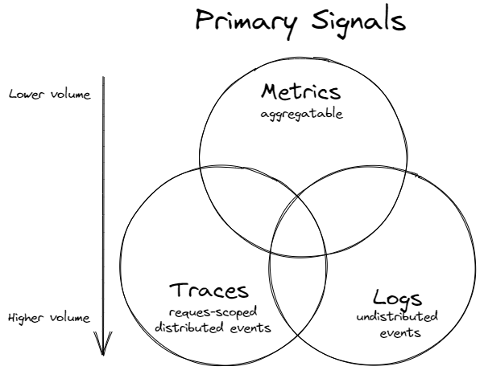
Logs store rich context for each event. Metrics compress activity into trend lines. Traces connect spans to prove cause and effect. Logs answer what happened inside a function call. Metrics answer how often it happens and whether it drifts from normal. Traces answer where in the path the slowdown begins.
Storage needs follow the same pattern. Metrics occupy the least space, logs the most, traces sit in the middle. Query styles differ too. Metrics respond to aggregation like rate or percentile. Logs require search. Traces need joins by trace ID. Choosing the right pillar keeps budgets in check and investigations fast.
How the Three Pillars Work Together
When checkout failures start climbing, the monitoring system raises an alert based on the error-rate metric. The on-call engineer opens the trace that the alert links to and notices that the payment service takes more than five seconds to respond, while every other service completes in less than one hundred milliseconds. The engineer then reviews the logs for that same request and finds repeated time-out messages from the card gateway together with the JSON payload sent by the application.
After reducing the gateway time-out value and adding a retry policy, the engineer deploys a patch. The error-rate metric returns to its normal level, a new trace shows the payment call finishing in about sixty milliseconds, and the logs confirm that charges now succeed without delay. Thus, what helps turning a vague symptom into a clear and verified fix is moving from metric to trace and ultimately to the log.
Tools and Ecosystem
Teams often choose Prometheus to gather metrics and Grafana to present the resulting dashboards. For logs they route data through collectors such as Fluent Bit or Vector, then store the records in Loki, Elasticsearch, or OpenSearch. Trace data usually comes from OpenTelemetry libraries and lands in Jaeger, Tempo, or Zipkin. Commercial services like Datadog, New Relic, and Honeycomb combine all three data types in a single console, which reduces setup time. A practical architecture sends every event through one pipeline, applies consistent tags, and directs each record to the right storage layer. The best stack depends on expected data volume, retention goals, and the team’s experience rather than on brand popularity.
Many organisations build a single ingestion path that tags each event once, then routes it to the right store. This keeps context aligned and reduces duplication. Tool choice depends on expected data volume, retention goals, and team skill rather than brand reputation.
Challenges and Best Practices
Here’s a breakdown of the key difficulties faced in the process and counter measures:
| Challenge | Best practice to mitigate it |
| Cardinality explosion | A metric labelled with user ID can create millions of time series. Keep user-level data in logs, not metrics. |
| Correlation gaps | Without a shared request ID, engineers line up dashboards by timestamp and hope clocks agree. Inject IDs into every header and log entry. |
| Data privacy | Logs can carry sensitive data. Mask fields at the source and apply retention policies that match regulations. |
| Alert fatigue | Endless low-value alarms dull the pager. Tie alerts to service-level objectives so only customer-facing issues ring and it’s good to go. |
| Lack of ownership | Every dashboard, query, and alert needs a named maintainer. Store that mapping in code so updates follow normal review. |
Conclusion
Metrics point to trouble, traces show where it starts, and logs explain why. Treat the three pillars as partners and recovery becomes quicker, post-incident reviews clearer, and new features safer to ship. Use metrics for trends, traces for context, logs for detail. Manage cardinality, propagate request IDs, and maintain clear ownership, and the old debates of logs vs metrics or logs vs traces fade away. Every incident arrives with facts, not guesswork, and customers stay happy while the engineering team keeps the system steady.