Every reliability story begins with numbers. Four stand above the rest: mean time between failures (MTBF), mean time to repair or recovery (MTTR), mean time to failure (MTTF), and mean time to acknowledge (MTTA). Together they reveal how long systems run, how fast things break, how quickly humans notice, and how soon service returns. Treat them as the daily scoreboard for engineering discipline rather than a trivia set trotted out for audits. Once these metrics live on team walls and executive dashboards, priorities align and firefighting turns into planned practice.
What Is MTBF (Mean Time Between Failures)?
MTBF measures the average stretch of trouble-free operation between two unexpected, repairable incidents. To calculate it, add the service hours for a chosen period, exclude scheduled maintenance, divide by the count of failures, and you have a single, telling figure. A rising MTBF shows that tests, canary releases, and code reviews are working. A falling MTBF warns that new behavior: burst traffic, hidden dependencies, silent data corruption etc is eroding stability.
Example:
Picture a payments gateway that handled 2 000 operational hours last quarter and experienced four unplanned service breaks. Its MTBF equals 500 hours. The same service in the previous quarter ran 1 800 hours with three failures, or 600 hours MTBF. That drop flags that recent feature work injected fragility and needs inspection.
What Is MTTR (Mean Time to Repair/Recovery/Resolve)?
MTTR tracks how long a service stayed broken. The countdown begins with the first user-visible impact and ends only after the health checks confirm full recovery. Because it spans diagnosis, fix, and validation, it reflects both technical depth and team speed. A steady, low MTTR shows alerting, runbooks, and automation working in sync, while a climb flags gaps in escalation, tooling, or ownership.
Example:
A streaming service suffered two outages last month, each lasting 18 minutes and 42 minutes. The MTTR for the period is 30 minutes. Engineers then added auto-rollback to the deployment pipeline. The next month saw three outages, yet each was rolled back in under 10 minutes and MTTR dropped to 9 minutes. Customers noticed the difference; refund requests fell by half.
What Is MTTF (Mean Time to Failure)?
Unlike MTBF, which concerns items you can fix, MTTF models the lifespan of non-repairable components. Sensors, batteries, and some storage units reach a point where swap, not patch, restores service. To compute MTTF, total all operating hours for a fleet and divide by the number of items that reached end-of-life. Hardware teams use MTTF to schedule procurement and avoid shortages. Software teams apply the same idea to irreversible digital events such as certificate expiry.
Example:
A data center tracks 1000 solid-state drives that collectively logged 7 300 000 operating hours before 50 drives failed outright. The fleet’s MTTF stands at 146 000 hours, or a little over 16 years. That figure informs warranty negotiations and spares stocking levels.
What Is MTTA (Mean Time to Acknowledge)?
MTTA captures the delay between an alert firing and the moment a responder accepts ownership. Low MTTA shows that monitoring routes alerts to the right specialist, on-call schedules provide full coverage, and engineers trust the signal. Rising MTTA means noisy rules, unclear severity tags, or roster gaps. The clock on MTTR does not start until someone takes charge, so every unclaimed minute adds to the downtime. You can keep MTTA small by pruning alerts, tagging priorities, and handing off the responsibilities at each shift change.
Example:
Consider the case of Dutton Baskets, an e-commerce store where the team set an MTTA target of two minutes. During a promotional weekend their average slipped to six minutes because alerts flooded Slack without severity tags. They introduced alert grouping and priority labels, and MTTA returned to 90 seconds the following week.
Comparing MTBF, MTTR, MTTF, MTTA
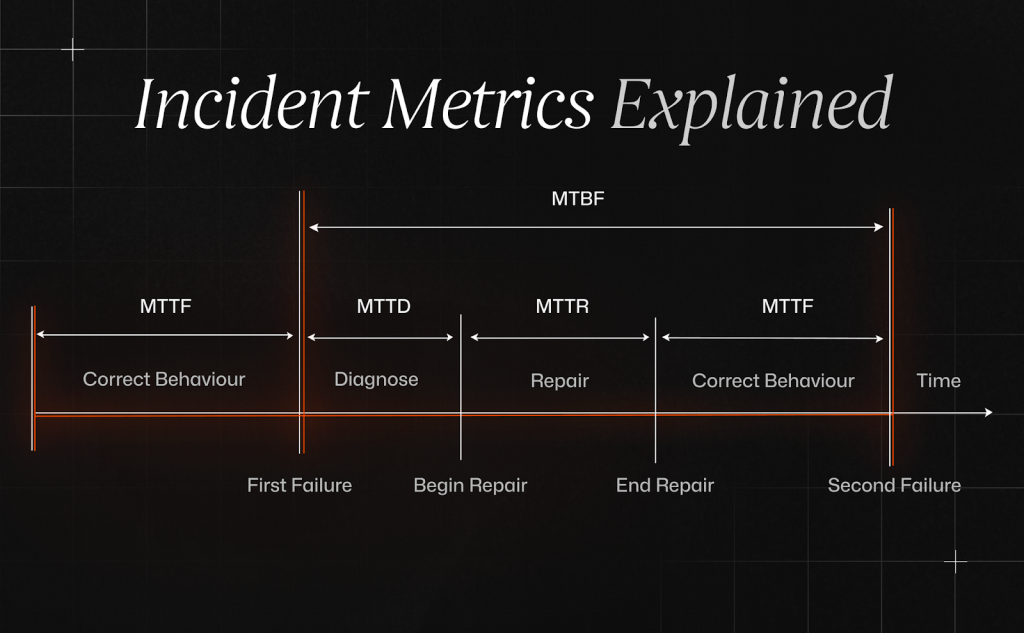
Imagine a timeline. MTBF defines calm periods. When failure strikes, MTTA measures the wake-up lag. MTTR covers the hands-on repair span. Running underneath, MTTF forecasts when core parts will die for good. Only by reading all four together can leaders see whether new investment should go toward prevention, faster detection, quicker recovery, or timely replacement.
If a service now fails only once a month instead of every week, yet the team still needs the same time to notice and fix each incident, users see little change. Real improvement appears only when outages grow rarer and repairs grow faster. Track that balance with composite availability: MTBF divided by the sum of MTBF and MTTR. A rising ratio means customers spend more of their time on a healthy platform.
Why These Metrics Matter
Downtime hurts revenue, sparks contract disputes, and drives up support costs. Finance teams track MTBF and MTTR because those numbers predict lost sales time and overtime pay. Asset planners study MTTF to schedule hardware replacements before parts fail. Operations managers watch MTTA to be sure on-call coverage is tight. When engineers propose a fix, they must point to the metric it will improve so leaders can see the payoff in clear, shared numbers.
Best Practices for Using Incident Metrics
Set one glossary so every team starts and stops clocks uniformly. Automate metric collection at the monitoring layer so data remains tamper-free. Break down figures by service, region, and release ring to spot local anomalies. Add narrative through post-incident reviews so numbers teach real lessons. Publish rolling thirty-day averages to smooth noise while still catching drift. Finally, reward the teams that refine process rather than those who merely keep numbers pretty; metrics serve coaching, not blame.
Case in point: a logistics platform grew from ten to eighty microservices in a year. Leadership feared a reliability slide. They embedded metric export hooks in each service, set alerts on MTBF deviations, and created a twice-monthly review. Twelve months later, MTTR sat at 11 minutes, MTTA at 70 seconds, and MTBF had climbed 40 percent despite quadrupled traffic.
Common Pitfalls & Limitations
Numbers mislead when they hide behind single averages. A median recovery of five minutes can mask one catastrophic outage lasting an hour. Including maintenance in MTBF inflates reliability. Marking tickets as acknowledged by bots instead of humans fakes a low MTTA. Focusing on MTTR alone may encourage quick but unsafe patches that cause future incidents. Treat MTTF as probabilistic; identical drives fail at different ages. Always validate metrics with context, sample size, and distribution graphs before celebrating.
Conclusion
Reliability lives in the quiet pauses between failures and the quick moves during them. MTBF shows how often calm prevails. MTTA reveals how alert the team remains. MTTR reports how quickly customers regain service. MTTF informs when hardware or irreversible components deserve refresh. Master all four and you will steer resources to the right problems, argue budgets with authority, and turn instability into sustained confidence. One article cannot remove every outage, yet these metrics, tracked and acted upon, give any team the clearest possible map from chaos to control.