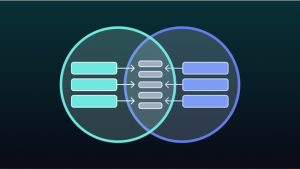
Business intelligence tools help organizations turn raw data into dashboards, reports, and actionable insights. Among the widely used platforms, Tableau and Looker are two prominent choices for data visualization and business analytics.
Although both platforms support data exploration, dashboards, reporting, and self-service analytics, they approach business intelligence differently. Tableau has a strong emphasis on visual exploration and interactive analytics, while Looker places significant emphasis on governed data modeling through LookML and a centralized semantic layer.
Understanding these differences is useful for data analysts, business intelligence professionals, developers, and anyone learning modern analytics tools.
- Tableau vs Looker is not simply a comparison of two visualization tools. Their approaches to data modeling, governance, exploration, and deployment are different.
- Tableau is particularly focused on interactive visual analytics and flexible dashboard creation.
- Looker uses LookML and a centralized modeling approach to define business logic and metrics consistently.
- Tableau supports data preparation, visualization, dashboards, analytics, and enterprise governance through products such as Tableau Cloud, Tableau Server, and Tableau Prep.
- Looker combines data exploration, visualization, dashboards, embedded analytics, and a governed semantic modeling layer.
- Tableau Cloud uses role-based and capacity-based licensing options, while Looker pricing generally combines platform and user pricing and is provided through customized quotes.
- The choice between Tableau and Looker depends on factors such as visualization requirements, data architecture, governance, technical skills, cloud environment, and how business metrics are managed.
What is Looker?
Looker is Google’s business intelligence and data analytics platform. It allows organizations to explore, analyze, visualize, and share data while maintaining a centralized approach to business definitions and data governance.
A major part of Looker’s architecture is LookML, its modeling language. Instead of allowing every dashboard user to independently define calculations and relationships, organizations can define business logic within LookML and expose governed data models to users.
Looker documentation describes an Explore as an interactive environment where users can select fields, apply filters, and construct queries based on definitions established in the project files.
For example, a company could define revenue centrally:
measure: total_revenue {
type: sum
sql: ${TABLE}.revenue ;;
value_format_name: usd
A business user can then use the defined metric without having to recreate the underlying SQL calculation every time.
Looker features
Some important Looker capabilities include:
- LookML-based data modeling
- Interactive data exploration
- Dashboards and visualizations
- Governed business metrics
- Embedded analytics
- APIs for integrating analytics into applications
- Data access controls and permissions
- Scheduled reports and data deliveries
- Integration with Google Cloud services
- Version-controlled analytics development
Looker dashboards can contain multiple queries displayed as visualizations, and users can interact with filters, alerts, schedules, and data downloads depending on their permissions.
Looker also provides Explore functionality that allows users to select fields, filter data, create visualizations, and investigate underlying results without manually writing every SQL query.
Looker use cases
Looker can be useful for:
- Enterprise business intelligence
- Governed analytics
- Embedded analytics applications
- SaaS analytics
- Customer-facing dashboards
- Centralized KPI management
- Marketing and sales analytics
- Financial reporting
- Product analytics
- Data applications
For example, a SaaS company could define customer lifetime value, monthly recurring revenue, churn, and customer acquisition cost centrally in its LookML model. Different teams could then use those definitions in dashboards without independently rebuilding the calculations.
What is Tableau?
Tableau is a visual analytics and business intelligence platform designed to help users explore data and create interactive visualizations.
Its approach is strongly centered around visual analysis. Tableau allows users to connect to different data sources, drag fields into visualizations, apply filters, build dashboards, and investigate patterns interactively.
Tableau describes its visual analytics approach as using visual feedback to help users explore data and progressively ask more detailed questions. Its VizQL technology translates visual interactions into queries against the underlying data.
Tableau’s product ecosystem includes Tableau Desktop, Tableau Cloud, Tableau Server, Tableau Prep, and Tableau Mobile.
Tableau features
Key Tableau capabilities include:
- Interactive data visualization
- Dashboard development
- Data preparation
- Multiple data-source connectivity
- Calculated fields
- Advanced analytics
- Mapping and geographic analysis
- Data blending and relationships
- Tableau Cloud
- Tableau Server
- Data governance
- Embedded analytics
- Tableau Pulse and AI-assisted analytics
For example, a Tableau calculated field can create a profit ratio directly within an analysis:
SUM([Profit]) / SUM([Sales])
The calculated field can then be used in charts, dashboards, filters, and other analytical views.
Tableau also provides data preparation capabilities through Tableau Prep, which can be used to combine, shape, and clean data before analysis.
Tableau use cases
Tableau is commonly used for:
- Executive dashboards
- Sales analytics
- Marketing reporting
- Financial dashboards
- Customer analytics
- Operational reporting
- Geographic visualization
- Performance monitoring
- Data storytelling
- Self-service business intelligence
For example, a sales team could connect Tableau to CRM and financial data to create an interactive dashboard showing revenue by region, product category, sales representative, and month.
Looker vs Tableau
The most important differences between Looker and Tableau become clearer when looking at how each platform approaches visualization, data modeling, governance, and pricing.
1. Data Visualization: Tableau and Its Visual Analytics Strength
Tableau has a strong focus on visual exploration. Users can interact with data through charts, dashboards, filters, maps, calculated fields, and other visual components. Tableau’s visual analytics approach is designed around allowing users to see patterns and investigate questions directly through visual interaction.
For example, an analyst can start with a basic sales chart and quickly change dimensions, filters, aggregation, or chart types to investigate why sales changed.
This makes Tableau particularly useful when the analytical workflow involves:
- Exploring unfamiliar datasets
- Creating highly interactive dashboards
- Building visual reports
- Performing ad hoc analysis
- Presenting insights to non-technical stakeholders
- Working extensively with maps and visual storytelling
Looker also supports visualization and interactive exploration. However, its visualization experience is closely connected to the underlying LookML model and Explore framework. Users select fields and filters defined by the model and can visualize the resulting queries.
Therefore, the difference is not that one platform can visualize data and the other cannot. Both can. The distinction lies more in how users reach those visualizations and how much of the underlying business logic is centralized.
2. Governed Analytics: Looker’s Structural Approach
Governance is one of the most significant differences when comparing Looker and Tableau.
Looker uses LookML to define dimensions, measures, relationships, and business logic. Those definitions can then be reused across Explores and dashboards.
For example:
measure: average_order_value {
type: average
sql: ${order_value} ;;
value_format_name: usd
}
If the organization changes how average order value should be calculated, the underlying model can be updated rather than requiring every dashboard creator to manually change the calculation.
Looker describes its platform as providing a unified data model intended to support governance and a single source of truth for key metrics.
Tableau also provides governance capabilities. Tableau Cloud, for example, includes capabilities for managing users, permissions, certified data sources, lineage, data quality warnings, and other governance functions depending on the edition and license. The practical difference is that Looker’s governance model is closely tied to its semantic modeling architecture, while Tableau provides governance around a broader visual analytics platform.
3. Looker vs Tableau Pricing
Pricing is another important consideration, but there is no single price that applies to every organization.
As of 2026, Tableau Cloud offers multiple editions and licensing models. Tableau’s published pricing includes Standard and Enterprise editions with role-based licensing, while higher-tier Cloud+ capabilities use contact-sales pricing. Tableau also offers capacity-based pricing for certain deployments.
Looker pricing works differently. Google Cloud describes Looker pricing as having two primary components: platform pricing and user pricing. The platform component covers the Looker instance and capabilities such as administration, integrations, and semantic modeling, while user pricing depends on user types and permissions. Organizations generally work with Google Cloud sales for a customized quote.
This means pricing should be evaluated against the organization’s actual requirements rather than comparing only a headline license price.
When evaluating costs, consider:
- Number of creators and viewers
- Number of developers
- Data volume
- Embedded analytics requirements
- Governance requirements
- Cloud infrastructure
- Administrative overhead
- Training requirements
- Existing technology investments
4. Looker vs Tableau by Industry
The appropriate BI platform can also vary depending on the industry’s data requirements.
1. Financial Services and Banking
Financial organizations typically deal with sensitive data, regulatory requirements, complex reporting, and large numbers of business metrics.
Looker can be useful when an organization wants centralized definitions for metrics such as:
- Assets under management
- Customer lifetime value
- Loan performance
- Revenue
- Default rates
- Customer profitability
Tableau can be useful for interactive financial dashboards, portfolio analysis, geographic reporting, and visual exploration.
For example, a bank could use Tableau to build an executive dashboard showing loan performance by region while using governed data sources and permissions to control access.
2. Retail and Consumer Packaged Goods
Retail organizations often analyze sales, inventory, customers, products, stores, promotions, and supply chains.
Tableau can be useful when teams need highly interactive visualizations of:
- Sales trends
- Store performance
- Product performance
- Geographic sales
- Customer behavior
- Inventory movement
Looker can be valuable when retailers want standardized definitions across different teams and applications.
For example, an organization could define “net sales” centrally in LookML so that finance, marketing, and product teams use the same calculation.
3. Healthcare and Life Sciences
Healthcare organizations work with clinical, operational, financial, and patient-related datasets.
Both platforms can support analytics use cases such as:
- Operational performance
- Resource utilization
- Financial analysis
- Patient service analytics
- Research reporting
- Workforce analytics
However, implementation needs to consider privacy, security, access controls, and regulatory requirements. The appropriate platform configuration depends on the organization’s specific architecture and compliance requirements.
4. Operations and Supply Chain
Operations teams often need to monitor large numbers of metrics in near real time.
Examples include:
- Inventory levels
- Delivery times
- Warehouse performance
- Supplier performance
- Production volumes
- Order fulfillment
- Logistics costs
Tableau can help teams visually investigate operational trends and exceptions.
Looker can provide a centralized modeling layer when multiple operational teams need consistent definitions for metrics such as order fulfillment rate or inventory turnover.
Conclusion: Should You Use Looker or Tableau?
The question of Tableau vs Looker is better approached as a question of requirements rather than simply asking which tool is better.Tableau is particularly suited to organizations that prioritize interactive visual analytics, flexible dashboards, visual exploration, and data storytelling.
Looker is particularly suited to organizations that want a strong semantic modeling approach, centralized business definitions, governed self-service analytics, and integration with data applications.
The technical environment also matters. Teams already invested heavily in Google Cloud may find Looker’s integration with the Google Cloud ecosystem relevant, while organizations looking for a broad visual analytics platform may evaluate Tableau Cloud or Tableau Server based on their deployment requirements.
For someone learning data analytics, understanding both approaches is valuable. Tableau develops skills in visual analytics, dashboard development, calculated fields, and data storytelling. Looker introduces concepts such as semantic modeling, LookML, governed metrics, Explores, and analytics development workflows.
Rather than treating Tableau vs Looker as a universal winner-takes-all comparison, evaluate the tools against the data architecture, users, governance model, visualization requirements, technical skills, and business problems they need to solve.
Frequently Asked Questions
1. What is the difference between Tableau and Looker?
Tableau and Looker are both business intelligence and analytics platforms, but they have different approaches to analytics. Tableau places a strong emphasis on visual exploration and interactive data visualization, while Looker uses LookML and a centralized modeling approach to define and govern business logic.
Tableau is often used for dashboard development, visual analysis, reporting, and data storytelling. Looker combines data modeling, exploration, dashboards, and embedded analytics around a governed data model.
2. Which is better, Tableau or Looker?
Neither platform is universally better for every organization. The appropriate choice depends on the organization’s requirements. Tableau can be a strong fit when interactive visualization and flexible visual exploration are major priorities. Looker can be a strong fit when centralized metric definitions, semantic modeling, governed self-service analytics, and embedded analytics are important. The decision should also consider existing data infrastructure, user skills, deployment requirements, licensing, and governance needs.
3. What are the key differences between Tableau and Looker?
The major differences involve data modeling, visualization workflows, governance, pricing, and technical architecture.
Tableau is strongly oriented toward visual analytics and interactive dashboards. Looker uses LookML to define reusable business logic and provides users with governed Explores based on that model. Their pricing structures also differ. Tableau Cloud provides published role-based and capacity-based licensing options, while Looker combines platform and user pricing and generally requires a customized quote.
4. Is Tableau easier to use than Looker?
Ease of use depends on the user’s role and the type of work they need to perform. Tableau’s drag-and-drop visual analytics experience can be approachable for analysts and business users who want to create visualizations and dashboards without writing extensive code. Looker can require more familiarity with its modeling concepts, particularly for developers working with LookML. Once the underlying model is established, however, business users can explore governed data through Looker’s Explore interface without necessarily writing SQL themselves.
5. Which is better for data visualization, Tableau or Looker?
Both Tableau and Looker support charts, dashboards, interactive analysis, and data visualization. Tableau has a particularly strong emphasis on visual exploration and data storytelling. Its platform is designed around visual interaction with data and supports a broad range of visualization and analytical workflows.
Looker also provides visualization capabilities through Explores and dashboards, with visualizations built from queries against the organization’s modeled data. The more important consideration is how visualization fits into the organization’s overall analytics workflow: whether the priority is flexible visual exploration, governed metrics, centralized modeling, embedded analytics, or a combination of these capabilities.